Problems worthy of attack prove their worth by hitting back. —Piet Hein

Sunday 5 July 2015

The Earth Moon Game

If the Moon were the size of a tennis ball then the Earth would be the size of a basketball. How far apart should the balls be placed so that the distance is to scale?

Before you read on, you might like to have a go yourself. If you don't have a tennis ball and basketball to hand, you can play with this online version I wrote.

My kids and I had a stall at our school fair this Friday where we played this as a game:


The Earth's diameter is 12,742 km and the Moon's is 3,475 km, so the Earth's diameter is about 3.7 larger. (We measured the basketball's diameter to be 23.5 cm, and the tennis ball to be 6.5 cm, so the ratio is about 3.6, which is pretty close!)

The Moon is (on average) 384,400 km from the Earth (the Lunar distance, measured from the centres of the two bodies), which is 111 times the Moon's diameter. Scaling this to the tennis ball, we get a distance of 111 × 6.5 cm = 7.2 metres.

Here's a picture showing the results at the end of the fair:


The basketball representing the Earth is in the bottom of the picture, and the tennis ball just visible at the top is the Moon, 7.2 metres away. To the right of the green tape are white flags that are the players' guesses for where the Moon would be.

It's striking that all the guesses were too low. This seems to be a mixture of two things. Firstly, people really do think that the Moon is closer than it actually is. Secondly, people tend to copy other people, so they would place their flags close to where the others were. (We told everyone that the Moon didn't have to be restricted to the green tape - that just happened to be how long it was.)

We saw a few interesting tactics though. One girl put one flag so it was the closest to the Earth compared to all the other flags, then another so it was the furthest out. She seemed to think that everyone else had either over- or underestimated the distance - which of course they had! (She didn't win though, as someone put their flag even further out later on.) Someone else put five flags over a range of about 25cm where she thought the Moon would be.

The most successful approach seemed to be for the player to stand where the Earth is, and have someone walk away holding the tennis ball until it subtends the same angle as the Moon does in the sky (or your mind's eye). This is easier said than done, however. The player in fourth place (who was about five years old) used this technique.


Here's the data plotted graphically, with each flag shown as a line. The blue line represents Earth, and the orange line the Moon.
Interestingly, the guesses did not benefit from the Wisdom of Crowds effect, where the average tends to be a good predictor of the actual answer:
The opening anecdote [of the book of the same name by James Surowiecki] relates Francis Galton's surprise that the crowd at a county fair accurately guessed the weight of an ox when their individual guesses were averaged
For the Earth Moon Game, however, the median distance was 2.6 metres, and the mean was 2.7 metres, which was 2.3 standard deviations (sd=1.96 metres) from the true distance, 7.2 metres.

Sunday 19 April 2015

The Hay Dark Skies Festival, Reverend Thomas William Webb, and Jupiter

In 2013, the Brecon Beacons was designated a Dark Sky Reserve, and a year later the first Dark Skies Festival was held in Hay-on-Wye. The second festival took place this weekend, and my family went along to some of the activities.

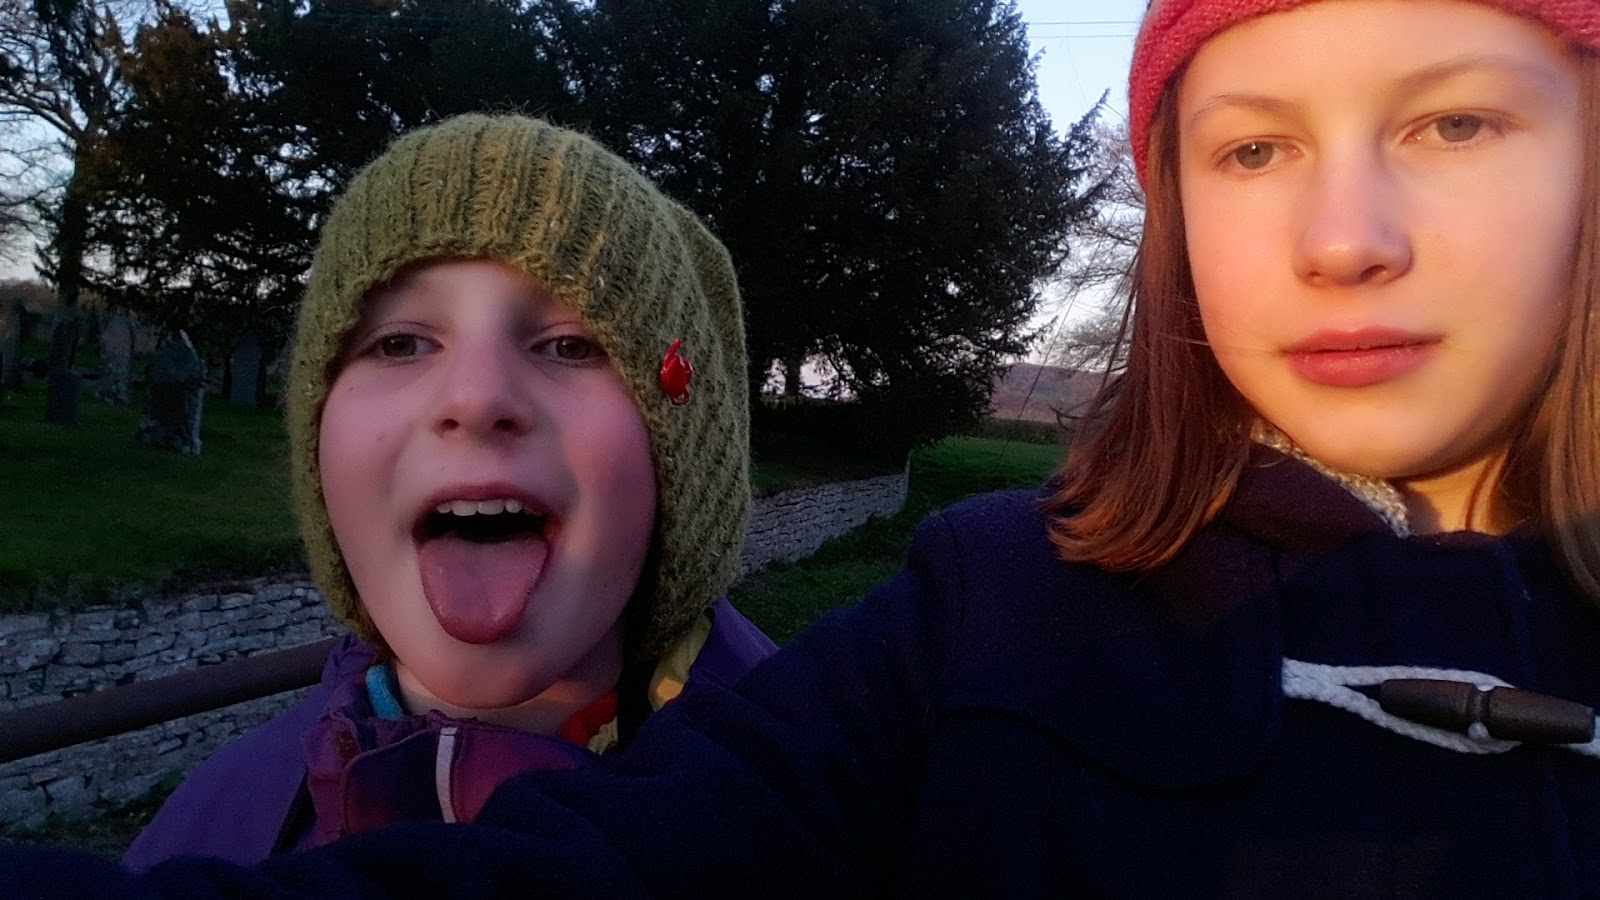
Young stargazers, Lottie and Millie
In the morning, we found ourselves in a planetarium tent, then we looked at sunspots, and held pieces of meteorite.

The evening event was stargazing at Holy Trinity Church in Hardwicke, just outside Hay. Quite apart from the lack of light pollution, the location was a special one, since the vicar of the parish from 1856 until 1885 was Reverend Thomas William Webb, who in his spare time observed the night sky with telescopes and an observatory he had built himself.
Holy Trinity Church, Hardwicke

In 1859, while at Hardwicke he wrote the classic book, Celestial Objects for the Common Telescope, the object of which was "to furnish the possessors of ordinary telescopes with plain directions for their use, and a list of objects for their advantageous employment".

The book remained in print well into the following century (and was recently republished by Cambridge University Press), and it's probably difficult to overemphasise the importance of this book in encouraging generation after generation of amateur stargazers.

In the words of Janet and Mark Robinson, who used to live in the vicarage and have edited a book about Webb,
Like Patrick Moore, he was an enthusiast who wanted to inspire as many people as possible to look through a telescope. Even at the choir party he "arranged the telescope and acted as showman and all in turn had a look at Saturn".
Webb would no doubt have been pleased to see yesterday's gathering of enthusiastic amateurs (including the Robinsons) with an impressive range of telescopes, on a cold but very clear night. The highlight for us was seeing Jupiter and its four brightest moons (Io, Europa, Ganymede and Callisto) through a large reflecting telescope. We could even see the north and south belts, and the Great Red Spot (or Pink Splodge as Lottie named it).

Sunset. Venus is visible top centre
Thank you to the organisers of the Hay Dark Skies Festival, and the volunteers from the Usk Astronomical Society (the oldest astronomical society in the UK), the Abergavenny Astronomy Society and the Heads of the Valleys Astronomical Society.

Sunday 8 March 2015

Tennis Ball Parabola


Here's an image of me throwing a tennis ball to Lottie:


Millie filmed the video and edited it down to a shorter segment. I turned the resulting video frames into a series of JPEGs by running:

ffmpeg -i Tennis\ Ball.mp4 tennis-%03d.jpeg

Then I composed them into a single image using ImageMagick:

convert -compose lighten tennis-014.jpeg tennis-015.jpeg \
-composite tennis-016.jpeg \
-composite tennis-017.jpeg \
...

-composite tennis-043.jpeg \
-composite result.jpeg

Millie then used Desmos (an online graphing editor) to superimpose a parabola on the image.

Update: Dima Spivak suggested I use the picture to estimate g, the acceleration due to gravity.
  • My head measures 0.22 m (chin to crown), and is 49 pixels on the picture.
  • The vertical distance, d, from the highest ball to the ball above Lottie's hands is 204 pixels, or 0.916 m.
  • The time, t, it took to travel this distance was between 12 and 13 frames (it's hard to say more precisely than this from the picture), which at 29.97 frames per second is between 0.4 and 0.434 seconds.
The acceleration is 2d/t2, which works out at between 9.7 and 11.4 m/s2. This range contains the accepted value of g, which is 9.8 m/s2.

Friday 16 January 2015

Hadoop for Science

Some of the largest datasets are generated by the sciences. For example, the Large Hadron Collider produces around 30PB of data a year. I'm interested in the technologies and tools for analyzing these kind of datasets, and how they work with Hadoop, so here's a brief post.

Open Data

Amazon S3 seems to be emerging as the de facto solution for sharing large datasets. In particular, AWS curates a variety of public data sets that can be accessed for free (from within AWS; there are egress charges otherwise). To take one example from genomics, the 1000 Genomes project hosts a 200TB dataset on S3.

Hadoop has long supported S3 as a filesystem, but recently there has been a lot of work to make it more robust and scalable. It’s natural to process S3-resident data in the cloud, and here there are many options for Hadoop. The recently released Cloudera Director, for example, makes it possible to run all the components of CDH in the cloud.

Notebooks

By "notebooks" I mean web-based, computational scientific notebooks, exemplified by the IPython Notebook. Notebooks have been around in the scientific community for a long time (they were added to IPython in 2011), but increasingly they seem to be reaching the larger data scientist and developer community. Notebooks combine prose and computation, which is great for exposition and interactivity. They are also easy to share, which helps foster collaboration and reproducibility of research.

It’s possible to run IPython against PySpark (notebooks are inherently interactive, so working with Spark is the natural Hadoop lead in), but it requires a bit of manual set up. Hopefully that will get easierideally Hadoop distributions like CDH will come with packages to run an appropriately-configured IPython notebook server.

Distributed Data Frames

IPython supports many different languages and libraries. (Despite its name IPython is not restricted to Python; in fact, it is being refactored into more modular pieces as a part of the Jupyter project.) Most notebook users are data scientists, and the central abstraction that they work with is the data frame. Both R and pandas, for example, use data frames, although both systems were designed to work on a single machine.

The challenge is to make systems like R and pandas work with distributed data. Many of the solutions to date have addressed this problem by adding MapReduce user libraries. However, this is unsatisfactory for several reasons, but primarily because the user has to explicitly think about the distributed case and can’t use the existing libraries on distributed data. Instead, what’s needed is a deeper integration so that the same R and pandas libraries work on local and distributed data.

There are several projects and teams working on distributed data frames, including Sparkling Pandas (which has the best name), Adatao’s distributed data frame, and Blaze. All are at an early stage, but as they mature the experience of working with distributed data frames from R or Python will become practically seamless. Of course, Spark already provides machine learning libraries for Scala, Java, and Python, which is a different approach to getting existing libraries like R or Pandas running on Hadoop. Having multiple competing solutions is broadly a good thing, and something that we see a lot of in open source ecosystems.

Combining the Pieces

Imagine if you could share a large dataset and the notebooks containing your work in a form that makes it easy for anyone to run them—it’s a sort of holy grail for researchers.

To see what this might look like, have a look at the talk by Andy Petrella and Xavier Tordoir on Lightning fast genomics, where they used a Spark Notebook and the ADAM genomics processing engine to run a clustering algorithm over a part of the 1000 Genomes dataset. It combines all the topics above—open data, cloud computing, notebooks, and distributed data frames—into one.

There’s still work to be done to expand the tooling and to make the whole experience smoother, nevertheless this demo shows that it's possible for scientists to analyse large amounts of data, on demand and in a way that is repeatable, using powerful high-level machine learning libraries. I'm optimistic that tools like this will become commonplace in the not-to-distant future.

Sunday 11 January 2015

Marmalade

I made some marmalade. I've never made it before, although I have memories of my parents making it every January, and how slicing the peel seemed to take hours. I used this meta recipe from Felicity Cloake that Eliane found, and it seemed to work pretty well.